

These are the Best U.S. Cities for Recruiting Sales, Operations, and Engineering Talent
Co-authored by Iulia Stefan.
If you are recruiting engineering, operations, and sales talent, then you are having a hell of a year. According to the Global Recruiting Trends 2017 report, these three roles are the highest priority to fill for recruiters across the world!
Obviously this means that there is a lot of competition and you need every little bit of intel in order to stand out and shape a sound recruiting strategy. To help with that, we dug into our rich LinkedIn data and pulled out valuable information to help you find and attract sales, operations and engineering professionals.
In this post, you will learn:
- Which US cities have the highest density of sales, engineering, operations talent
- Where the competition for this talent is the most intense
- Which cities are most affordable for candidates (great value prop!)
- How to use this information to enrich your candidate pitch
Let’s dive in.
Talent-dense locations: Engineering on the coasts, Sales in the South, and Operations in the Midwest and Southeast
Top 10 Hubs for Engineering, Sales, and Operations Functions in the United States
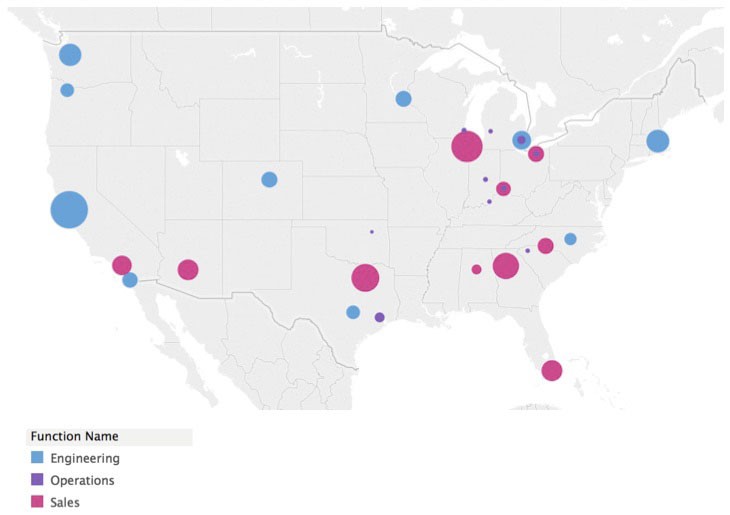
Bubble size indicates number of LinkedIn members by function in each metro area. Density is measured by the number of members in a particular function relative to total number of members per metro area
As you might guess, the areas with the highest density of engineering talent dot our coastlines: familiar hubs like Silicon Valley, Seattle, Boston, and Portland rise high above the rest. Sales hubs tend to congregate in the Southern US—with the notable exceptions of Chicago and Ohio. Operational talent centers around the Midwest, in metro areas around cities like Detroit, Milwaukee, Indianapolis, and Cleveland.
Below we’ve visualized the map results by talent density; take a peek and see where your metro area ranks.
Top 10 Hubs by Function, Ranked by Density
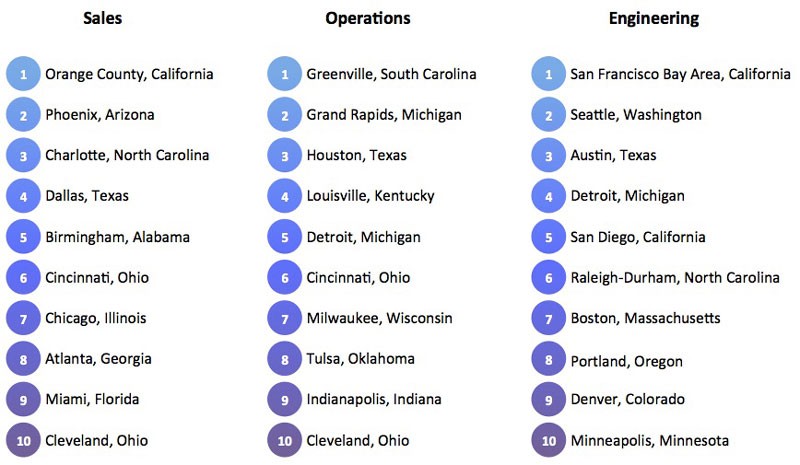
Density is measured by the number of members in a particular function relative to total number of members per metro area.
While talent density is an important factor in your recruiting success, demand is also an important dimension to consider as you craft your recruiting strategy. Two regions can have similar talent densities but very different demand for that talent, so it’s important to understand whether you are competing for the same talent in a low demand or high demand environment.
Consider sourcing candidates from cities with low demand and concentrated talent pools
Oftentimes, high density is conflated with high demand; however, our analysis reveals that high density doesn’t necessarily translate to high demand. Below, we’ll focus on how recruiters can optimize their hiring time by integrating the insights around talent demand and density into their sourcing and offer strategy.
Density vs. Demand
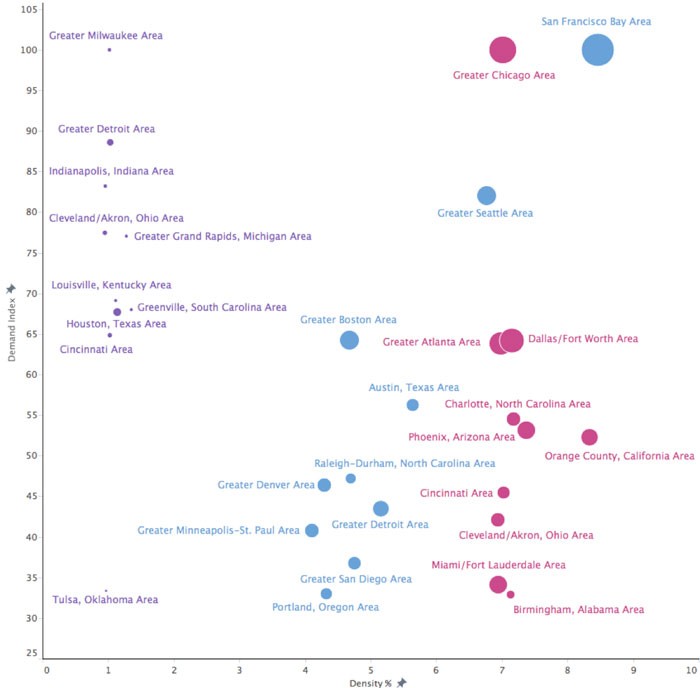
Demand is calculated as the average number of recruiter InMails received per member in 2016. Bubble size indicates number of LinkedIn members by function in each metro area.
If you’re a recruiter sourcing for any of these functions in the United States, the hubs in the chart above are a great place to start building a pipeline of candidates. To optimize your time, focus on sourcing from regions that have high density but relatively low demand compared to other hubs within each function.
Here are a few specific insights to illustrate some of the nuance and interplay between demand and density across metro areas:
- Unsurprisingly, San Francisco is the top engineering hub with respect to both density and demand. Perhaps more surprising is that Detroit ranks among the top six most dense engineering hubs, though currently at half the demand for this talent as San Francisco. While traditionally regarded as the world’s leading auto producer, Detroit has a lot to offer in the tech space as well. With the rise of autonomous vehicles and recent Silicon Valley partnerships, Forbes suggests Detroit could be America’s next tech hub.
- In the sales world, Orange County has the densest concentration of talent, but half the demand of Chicago. Retail, telecom and pharma giants like Nordstrom, AT&T and Pfizer all have a large corporate presence in Orange County. For example, you might not know about Pfizer’s 25-acre Orange County campus focused on Research and Development. These employers’ strong presence in Orange County illustrates why there is such a concentration of sales talent in the area. Meanwhile, AT&T is also among the top employers in Chicago and migrated 3,000 jobs from the nearby suburb of Hoffman Estates into the city between 2013 and 2016. This influx of new opportunities is an example of the types of trends that may be driving the higher demand for sales talent in Chicago.
- Greenville, South Carolina and Houston are among the most dense regions when it comes to operations talent. The most in-demand operations profiles include manufacturing operations manager, construction project manager, and e-commerce specialist; and with employers like BMW, Shell and United Airlines in Greenville and Houston, it is clear why there is such a high concentration of operations roles here.
For a deep dive on top industries, employers and occupations per function, please see the appendix.
As discussed above, expanding your recruiting efforts to lower-demand, high density regions can be a great way to build your pipeline of qualified talent. But if you’re tasked with the challenge of recruiting in a region with high demand for talent, simply focusing on density and demand is not enough. Density and demand can be attractive elements for candidates, but a metro area’s affordability—a measure of cost-of-living divided by average salary—might be one of its most enticing advantages. Read on to learn more about how each region stacks up when it comes to affordability.
Your city’s affordability—the cost-of-living relative to the average salary—can make a big difference to candidates
In high-demand, low-density environments, it can be challenging to fill open positions. In these cases, it’s good to know where your region ranks against other areas in terms of affordability. Expanding your candidate search to other regions that have a higher density of talent but which are also less affordable may help you fill those positions more quickly.
Affordability vs. Density
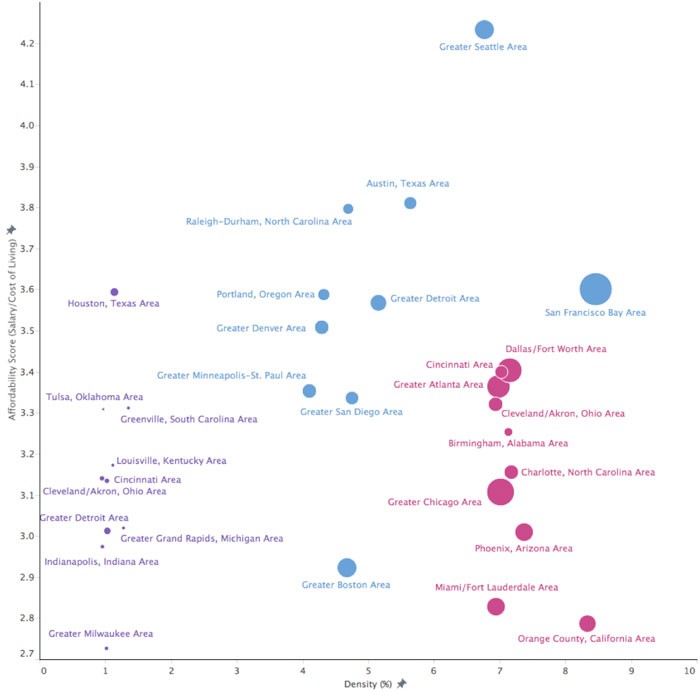
Affordability index is calculated by dividing the average annual salary with the average annualized cost of living for each metro area. Salary data is sourced from LinkedIn and cost of living data is sourced from the Economic Policy Institute.
The affordability metric gives us insight into some surprising truths. San Francisco seems far more expensive than Detroit, but they’re almost equally affordable—in fact, San Francisco is slightly ahead.
That’s because affordability doesn’t reflect raw salaries or costs-of-living: it’s the relationship between the two numbers. So while the cost-of-living in Silicon Valley is much higher than that of Detroit, the higher salaries in San Francisco more than make up for the expenses—and while Detroit offers lower salaries on average, the low cost-of-living makes up the difference. In both areas, employees’ salaries go farther than average.
If you’re recruiting for opportunities based in an affordable high-density city like Seattle or Austin, you can highlight both the dense community of like-minded individuals and the greater purchasing power of candidates’ dollars as key benefits.
If you’re recruiting for a less affordable market like Boston or the Miami-Fort Lauderdale area, you’ll need to look for ways to differentiate your offer, perhaps by bumping up your perks or salary packages. High-density, low-affordability areas may also be easier pools of talent to attract to cities ranked higher on the affordability scale.
Wherever you’re based, it never hurts to know where you stand relative to other metro areas around the country. Learn about your local markets, adjust your tactics according to their strengths and weaknesses, and leverage LinkedIn’s insights to draw the best talent to your city.
Curious to see examples of the top industries, occupations and employers featured in this study? Read on for a sampling from each of the functions analyzed.
Appendix: top industries, employers and occupations per function
Engineering
- Impressively, Seattle is the second-densest city for engineering and the single most affordable. While San Francisco is the densest, it’s not as affordable as Seattle, Austin, or Raleigh-Durham.
- No surprise: the top industries in Seattle for engineering talent are computer science, internet, and aviation/aerospace with top 10 employers including the likes of Microsoft, Amazon, and Boeing.
- The top engineering industries in San Francisco are similar, swapping aviation/aerospace for IT and services; top employers include Google, Apple, and Cisco.
- The top occupations for engineering are software developer, engineer, and technology manager.
Sales
- While Orange County is the densest sales hub, it’s also the least affordable. Phoenix, the second most dense sales hub, is also among the least affordable.
- Top sales industries in both regions include financial services, automotive, and IT and services. In Orange County, top employers included AT&T, Nordstrom, and Pfizer. In Arizona’s capital city, top sales employers included Yelp, Novartis, and Merck. Salesperson, sales specialist, and medical salesperson are the most common sales roles in the US. Pharma has a big footprint in both hubs, which helps explain why medical salesperson is the third-most common sales occupation.
Operations
Greenville, South Carolina isn’t just the most dense operations hub—it’s also the second-most affordable, behind only Houston. While greater Grand Rapids, Michigan is quite dense, it’s much less affordable than other dense hubs, while Milwaukee is the least affordable of all 10 hubs.
The top industries in Greenville include Automotive and Construction, with employers like BMW, Michelin, and Fluor, while Houston’s big on Oil and Energy and Construction, with top companies that include Shell, United Airlines, and ExxonMobil.
The most common operations positions are manufacturing operations manager, construction project manager, and e-commerce specialist.
Methodology
Data aggregated from public LinkedIn profiles. Function is inferred from job title. Affordability index is calculated by dividing the average annual salary (for that function in that area) by the average annualized cost of living for each metro area. Cost of living data is sourced and calculated from the Economic Policy Institute for a 2-adult, 1-child household based on average household size from the November 2016 Bureau of Labor Statistics report. Density is calculated as the number of LinkedIn members in a particular function and metro area divided by the total number of LinkedIn members in that metro area. Within each function, only occupations whose members received on average at least 1 recruiter InMail in 2016 were selected for the analysis.
To receive blog posts like this one straight in your inbox, subscribe to the blog newsletter.
Topics: Data insights
Related articles